Flood Hazard in Eugene, Oregon
Overview
Since the times of the westward expansion, several notable floods have impacted the southern Willamette Valley region near Eugene, OR. Living in Eugene, I recall the widespread flooding in October 2017 that inundated many of river-side parks, streets, and buildings.
 Flooding of the Willamette River into Alton Baker City Park in Eugene, OR. (Photo Credit: Marli Miller)
While the less populated, mostly vegetated Oregon Coast Range and local towns were most directly impacted in this storm event, the urban corridor of the Willamette Valley and its infrastructure was widely impacted. Despite these impacts, the 2017 flood event was considered small in the valley's modern history, with much larger events occuring in 1861, 1890, 1945, 1956, and 1964. The 1964 flood, referred to as 'the big flood,' is the largest recorded flood event in the southern Willamette Valley. A collection of historic photographs from the 1965 flood can be found here.
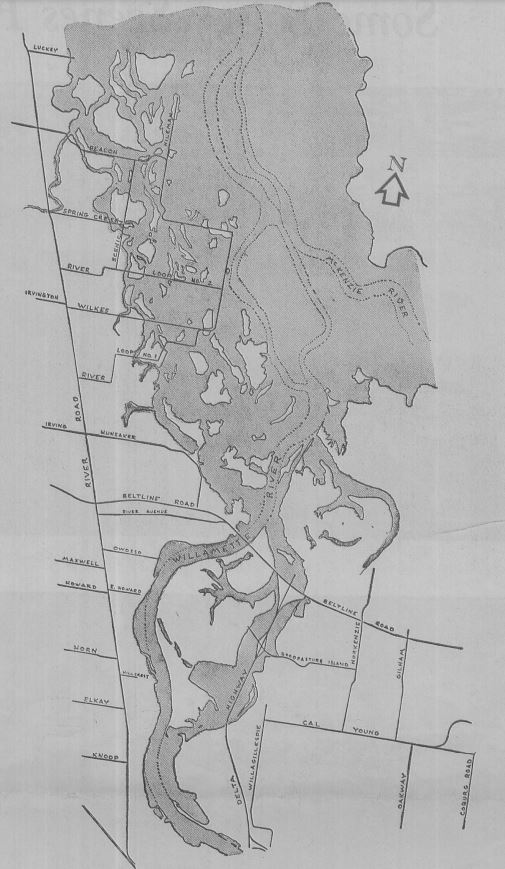
Flood Path of the 1965 'Big Flood' in the area north of Eugene, Oregon. Note the location of the Willamette River channel relative to the size of the flood innodation zone. The full, special edition newspaper covering the 1965 flood can be found here.
Maximum Annual Discharge - Willamette River, Willamette Valley South, Oregon
Description of the Willamette River Basin
The Willamette River is a major tributary of the Columbia River. The Willamette River begins in Eugene, OR at the confluence of the McKenzie, Middle Fork, and Coastal Fork rivers and flows 187 miles northward to the Columbia River, where it accounts for ~1/6th of the Columbia's total flow volume. Due to large volumes of annual precipitation (>60 in/yr) in the Pacific Northwest, the Willamette River floods often, requiring regular monitoring. Currently, the USGS operates five stream monitoring gauges along the Willamette River (Harrisburg, Corvallis, Albany, Salem, and Portland).
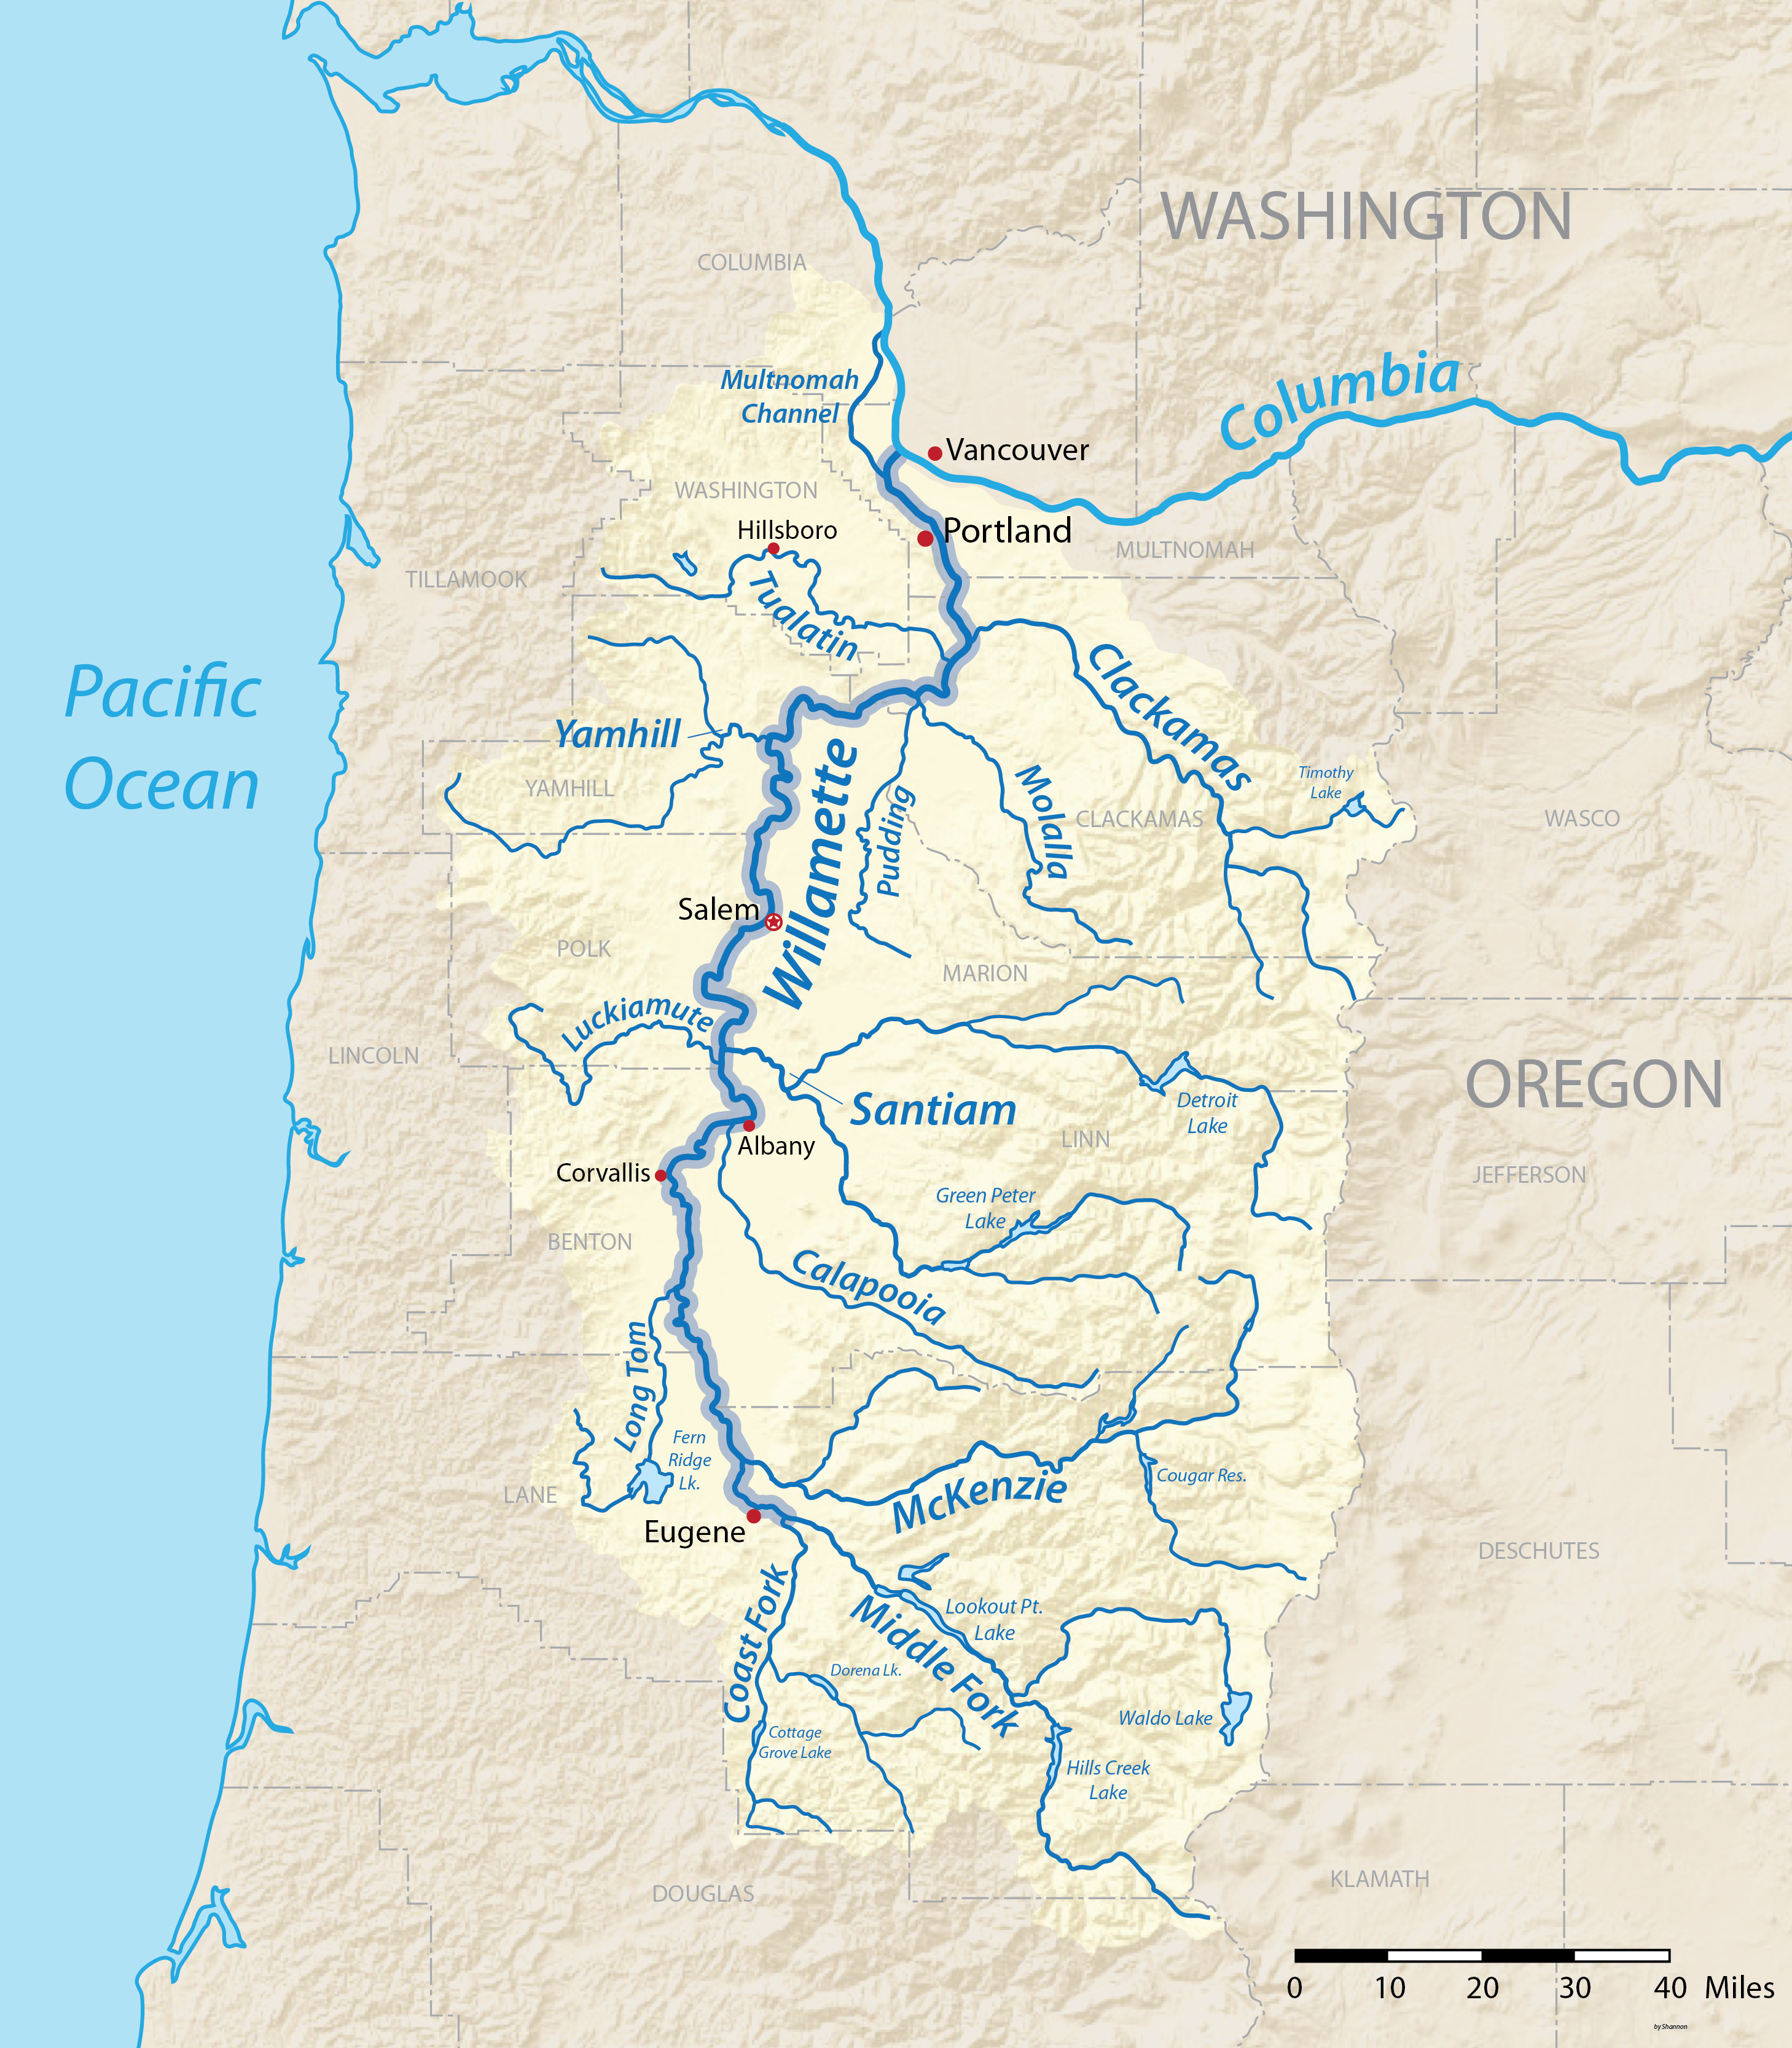
Location map of the Willamette River and its major tributaries (1).
The Willamette drainage basin was created by progressive and on-going tectonic processes and has been dramatically modified by volcanism and massive ice age flood events (e.g. Missoula Floods). Volcanic- and flood-based soils have made the Willamette basin one of the most fertile agricultural regions in North America, long attracting indigenous tribes and eastern settles to the region. More thebn 70% of Oregon's population lives in the Willamette Valley (2). The flora and fauna of the Willamette Valley have shifted dramatically in recent years from forested floodplains and perennial grass prairies to less forested farmlands and vineyards, supporting the local economy. Many species in teh region are now endangered, though the valley still supports huge biodiversity.
Stream Gauge Location - Willamette River at Harrisburg, OR
Data Description and Citation
Gauge Name & Location:
Willamette River at Harrisburg, OR - Gauge Number 14166000
Latitude: 44.27040126; Longitude: -123.1737036
USGS-NWIS Streamflow Data URL:
Description:
Discharge refers to the volume of water that passes through a given location, in this case a stream gauge, within a given period of time. For USGS gauge 14166000 on the Willamette River in Harrisburg, OR, the daily discharge data can be found here, and is reported in mean cubic feet per second. The data comes from the National Water Information System (NWIS) and is managed by the U.S. Geological Survey (USGS). NWIS provides data for more then 1.5 million sites across all U.S. states and territories and includes information related to surface water, groundwater, water qualty and use. Data are collected with automatic recorders and manual field measurements, where required.
Data Citation: U.S. Geological Survey, 2016, National Water Information System data available on the World Wide Web (USGS Water Data for the Nation), accessed September, 26, 2023, at URL https://waterdata.usgs.gov/nwis/dv?cb_00060=on&format=rdb&site_no=14166000&legacy=&referred_module=sw&period=&begin_date=1944-10-01&end_date=2023-09-25.
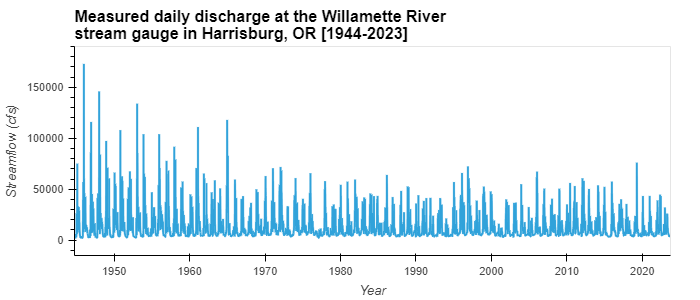
Measured daily dischages on the Willamette River at Harrisburg, OR declined dramatically through 1965.
The measured daily discharge at the Willamette River stream gauge in Harrisburg, Oregon shows a series of dramatic, but progressively declining, peak flood events through the mid-1960's, afterwhich peaks are maintained within a threashold less than ~80,000 cfs. This decline, followed by modulated discharge throught the present is likely related to the construction of more than 13 dams which were largely constructed between the 1940's to 1960s.
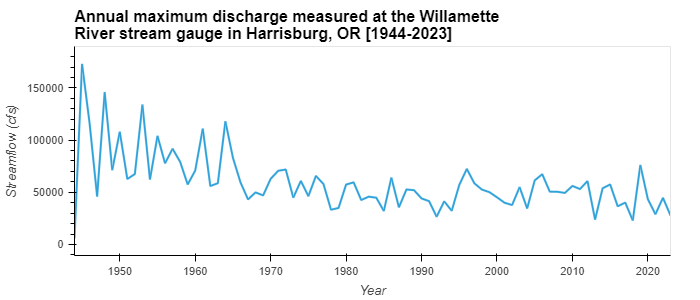
Large spikes in the annual maximum dischages on the Willamette River before 1965 suggest the regular occurance of large flooding events with smaller events thereafter.
The largest recorded flood events appear to occur in 1945, 1948, 1953, 1955, 1957, 1961, and 1964, all with discharges greater than 90,000 cfs. Following the construction of many dams in the river basin between the 1940's to 1960's, maximum annual discharges decreased below 80,000 cfs in high streamflow years.
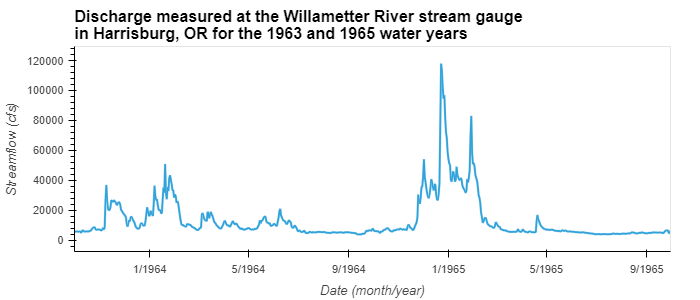
A large flood event took place in 1965, flooding large portions of the southern Willamette Valley.
Measured maximum daily discharges along the Willamette River at Harrisburg, OR indicate a peak flood discharge of nearly 118,000 cfs on 12/23/1964. The high streamflows lasted several days and were followed by another peak streamflow on 1/29/1965. Together, these events make up the 1965 flood of the southern Willamette Valley, often referred to as 'the Big Flood'. Ironically, this event was not even the largest of the century.
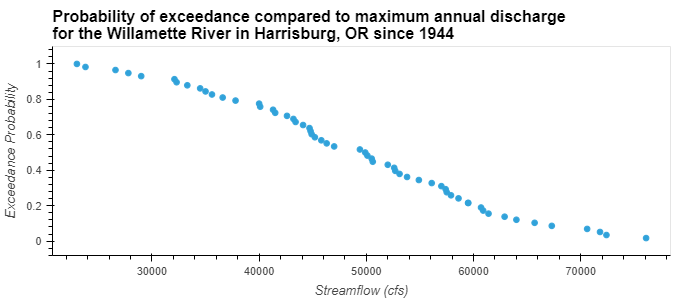
Flood Frequency Analysis for the Willamette River at Harrisburg, OR
A flood frequency analysis is a statistical approach to calculating the frequency of different magnitude discharge events from a record of peak streamflow and detemining the likelyhood that that streamflow will be exceeded in a given year. The exceedance probability, thus, is the probability that a given magnitude event will be matched or exceeded. The return period is the inverse of the exceedance probability and can be thought of as a recurrence interval or the average time of exceedance. The longer the record, the better the frequency analysis. Because the Willamette basin experienced a shift in discharge regimes following dam construction, the following flood frequency analysis focuses on the period after the last major flood from 1966-2023.
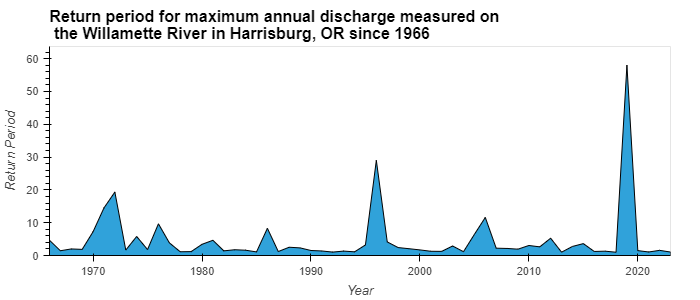
For the Willamette River stream gauge in Harrisburg, Oregon, higher return periods track high stream flow events. In other words, the recurrance interval for large discharge events is low compared to smaller, more frequent events.